
Infographics course results
To learn how to effectively present complicated scientific data and ideas to pictures and easily understandable graphics, we took part in the infographics course by SciComm Academy. The two part workshop was nicely explaining the basic principles of infographics that we have further implemented into our own infographic assignments presenting our own PhD research projects. After a first attempt, we had received feedback how we can improve our ideas and here comes the final results:

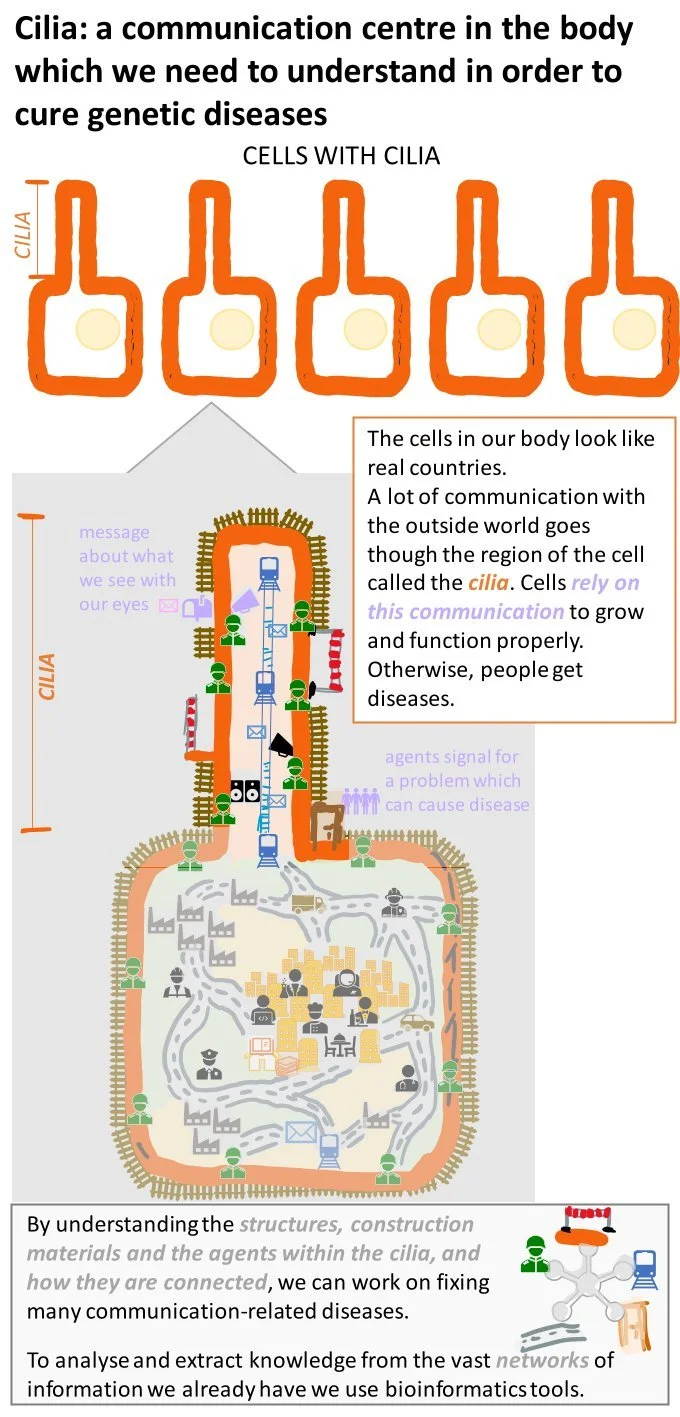
Nevin’s project (ESR1): The molecular basis of ciliopathy causing mutations in the ciliary assembly machinery

Kae’s project (ESR2): The role of actin dynamics in photoreceptor sensory cilium development and homeostasis
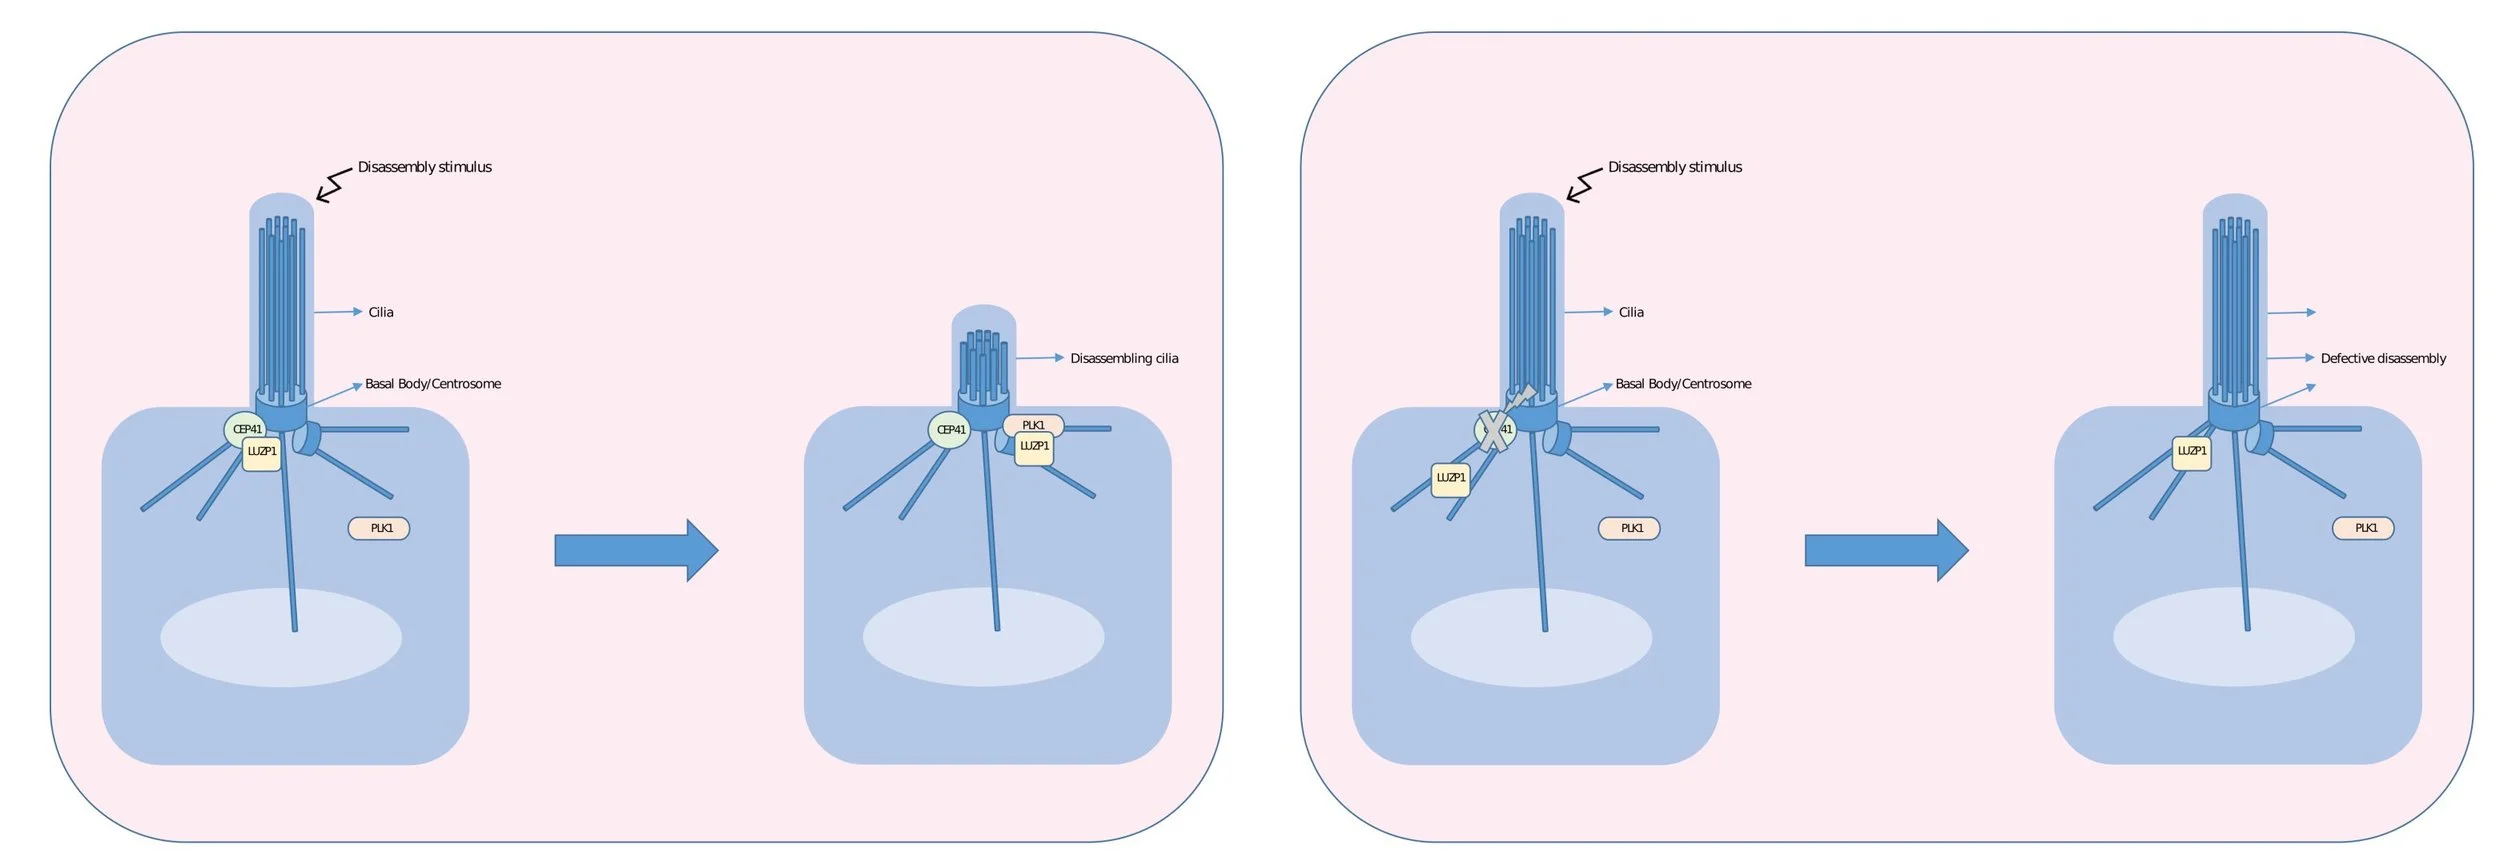
Shibu’s project (ESR3): Dissecting protein networks and regulatory mechanisms driving ciliary disassembly


Jindriska’s project (ESR5): Molecular mechanisms balancing the output of ciliary TGFβ/BMP signalling


Csenge’s project (ESR7): The role of DLG1 in regulating ciliary length and signalling capacity in kidney epithelial cells

Emma’s project (ESR8): The role of Joubert syndrome-associated proteins in neuronal development

Benni’s project (ESR9): Expanding ciliary pathways and ontologies

Giulia’s project (ESR10): Identification of altered signalling pathways in patients with renal ciliopathies


Daniel’s project (ESR12): Ciliary signalling in cardiovascular development and disease
Magi’s project (ESR13): Ciliopathy disease modules in the ciliary protein landscape

Katka’s project (ESR14): Ciliopathies disease modelling and characterization using zebrafish